AI Dashboard Marketplace
AI Dashboard Marketplace —
44 interactive demos across 11 functions.
Eleven business functions, forty-four interactive examples — each one a completely different layout, every one drillable, all modeled on real dashboards Peter Saddington builds for clients. Click a sector, watch the agents review it, and open any dashboard.
Talk to the Council — live AI chat →Every dashboard runs on illustrative demo data. Four AI agents review each set on video.
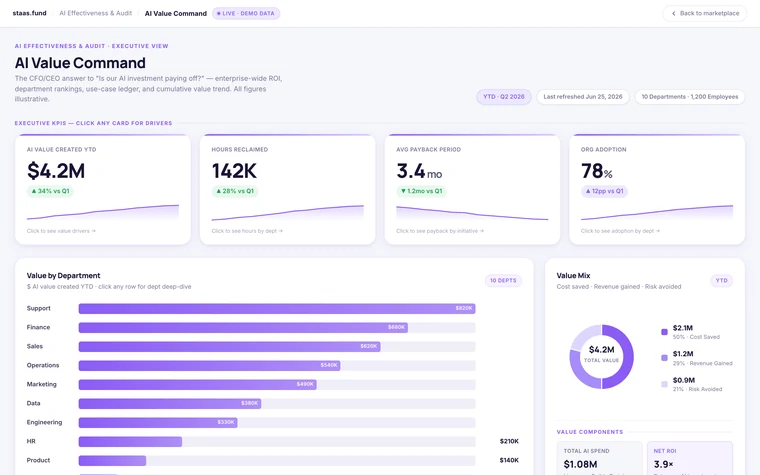
AI Effectiveness & Auditopen →
AI Effectiveness & Audit
Prove AI is paying off and prove it's governed — value, risk, adoption, and reliability across the whole company.
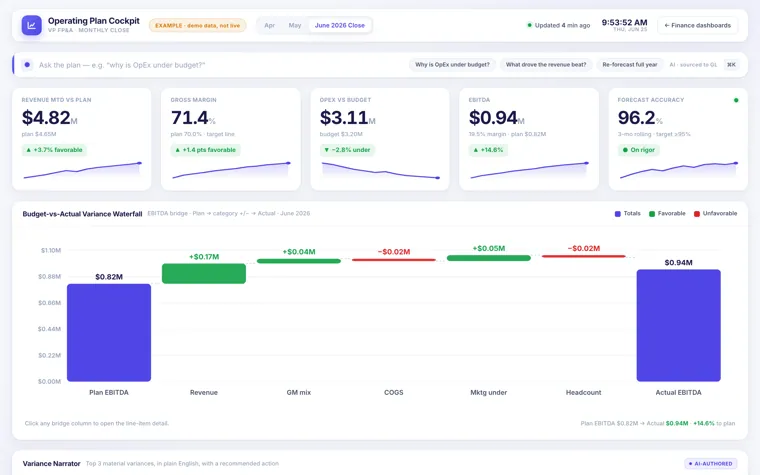
Finance & CFOopen →
Finance & CFO
FP&A close, treasury, unit economics, and the board pack.
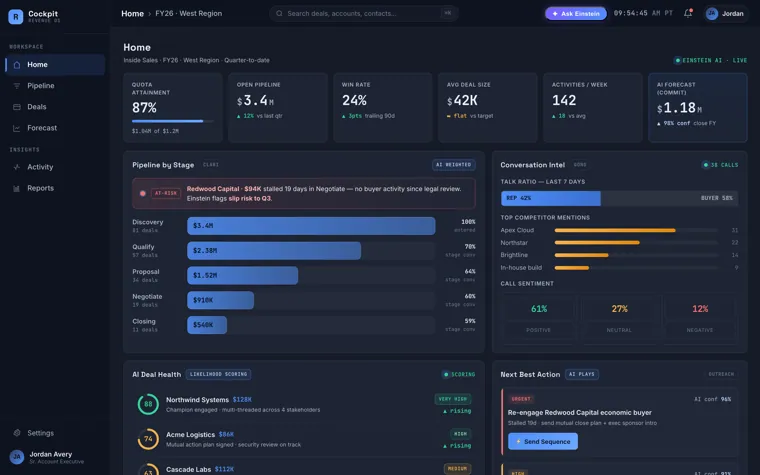
Salesopen →
Sales
Inside-sales, field, HubSpot, and outbound-prospecting cockpits.
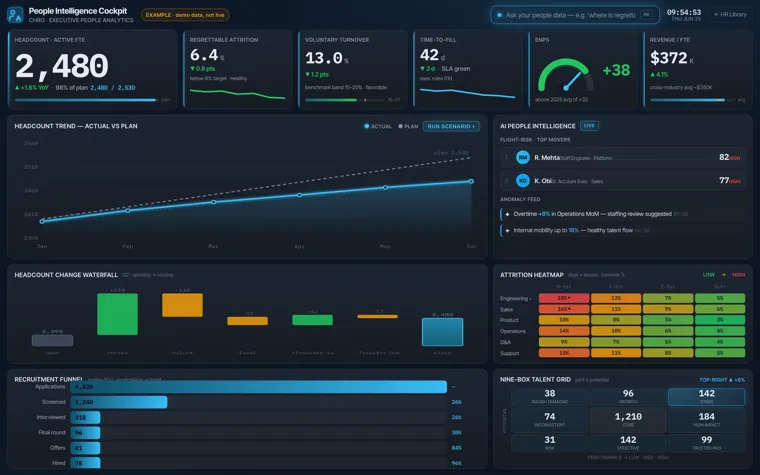
HR & Peopleopen →
HR & People
Analytics, hiring, culture, and HR service delivery.
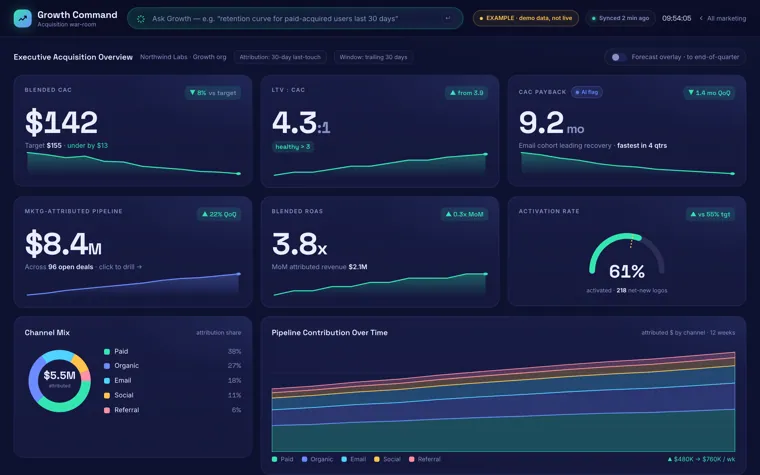
Marketing & Growthopen →
Marketing & Growth
Growth command, campaign ops, content/SEO, and brand.
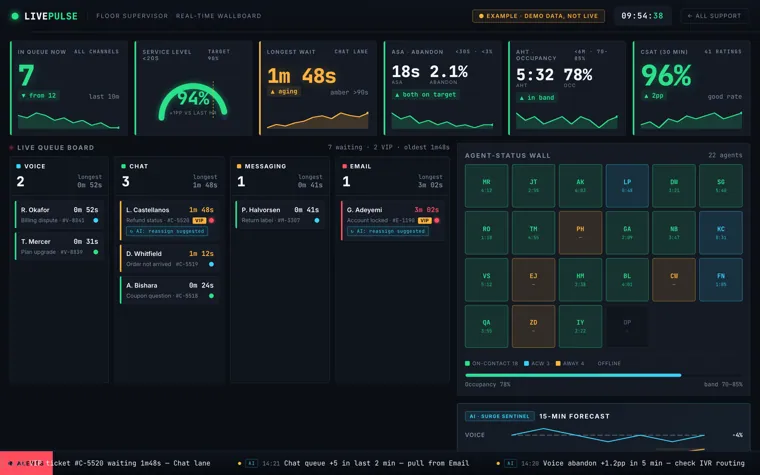
Customer Supportopen →
Customer Support
Live queues, quality, AI deflection, and capacity planning.
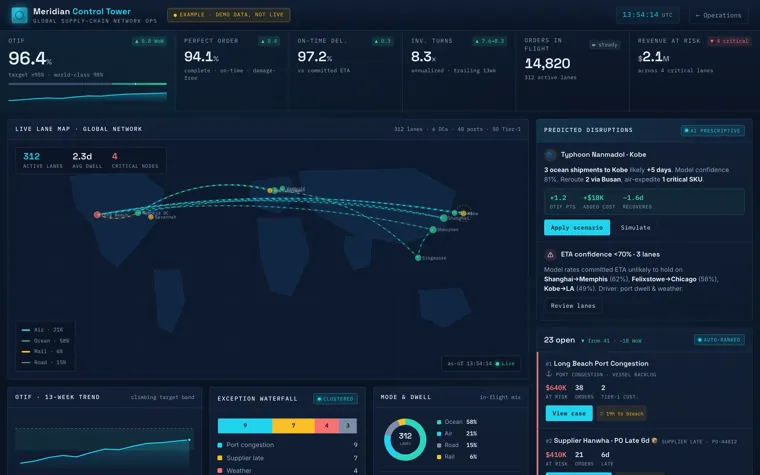
Operationsopen →
Operations
Control towers, OEE, live logistics, and dispatch.
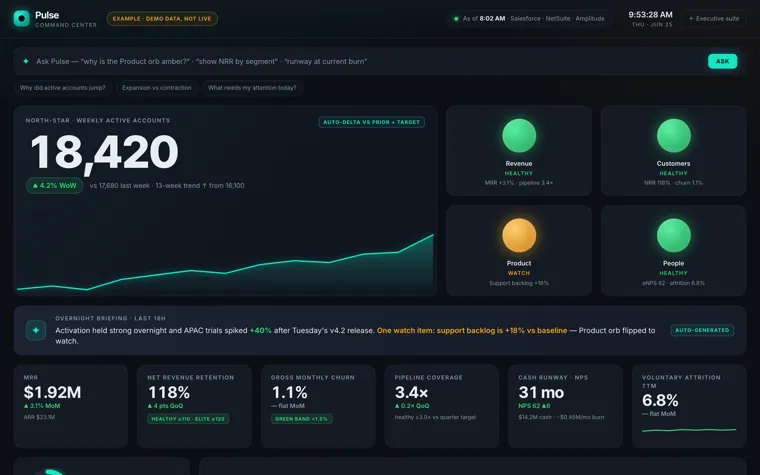
Executive & Boardopen →
Executive & Board
CEO scorecards, board books, OKR cascades, and scenarios.
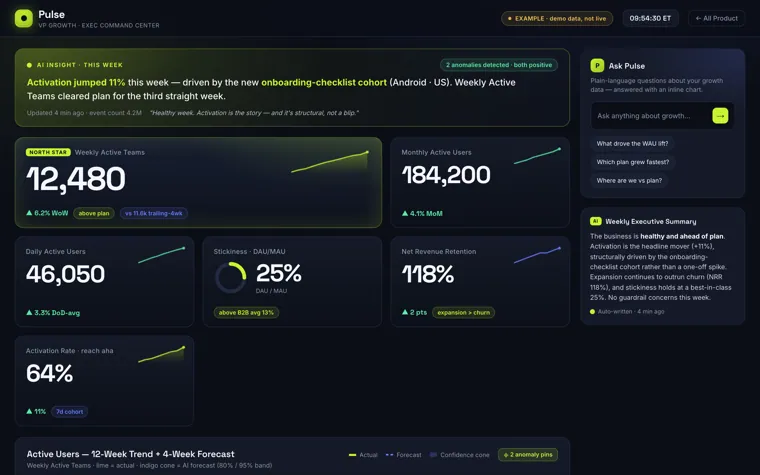
Product Analyticsopen →
Product Analytics
Activation & retention, funnels, adoption, experiments.
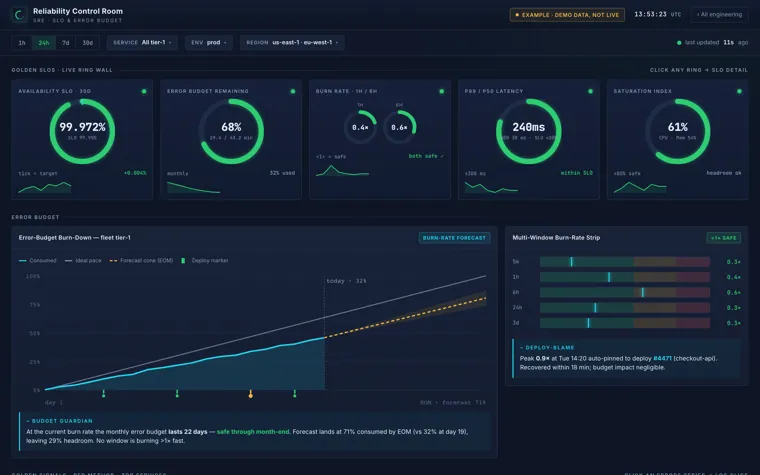
Engineering & DevOpsopen →
Engineering & DevOps
Reliability, delivery flow, incidents, and cloud cost.
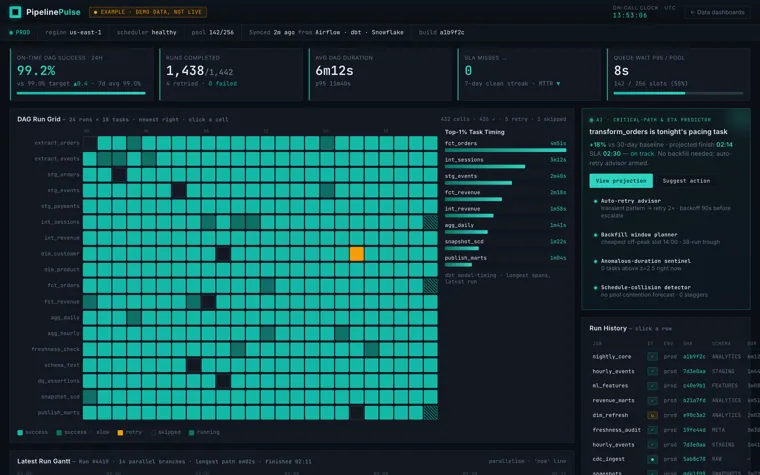
Data Platformopen →
Data Platform
Pipeline health, data quality, model monitoring, spend.
Bonus — real AI builds
Bonus · real buildopen ↗
The Kingdom — an AI team at work
What a morning looks like when four AI agents run a business overnight — each reports in its own voice.
Bonus · built by a teenopen ↗
A driver's dashboard — built with AI
A 16-year-old racer manages his whole season with a live dashboard he built himself using AI.
Step 0 · design the teamopen →
Agent Org Chart Builder
Before you pick dashboards, design the AI team behind them — a named head agent per department, sub-agents underneath, a Chief Agent on top. Then give each head a dashboard from this page.
The system behind the reviews
The agents reviewing these dashboards run a real company.
The four voices in the sector videos aren’t a gimmick — they’re production agents inside Peter’s Agentic Operating System, managing 14 live sites every day. Watch a single command get decomposed into a working company of agents: roles assigned, work handed down the chain, human approval before anything ships.
Proven impact — not hypothetical
This is what AI-enabled operations
actually delivers.
Every dashboard above is modeled on real work. Here’s the measurable outcome that work has produced for clients to date.
$1.7M+
in new revenue plus cost saved across active client engagements — from AI strategy, automation, and the kind of dashboards you see above.
$1M+
revenue at a multi-vertical agency executing the AI growth strategynow past the $1M mark; full-year figures finalizing
~$700K
saved at a healthcare AI platform — transcription & patient-access efficiencysavings being formalized as data lands
~14,000hrs/yr
staff-hours reclaimed from manual, repetitive workestimated from deployed automations
Days→min
reporting cycles that used to take days now refresh live
44/ 11
interactive AI dashboards shipped across eleven business functions
24/7
AI agents running real operations — overnight, every night
Figures reflect active engagements and are being finalized as full-period data lands; hours-saved is a conservative estimate from deployed automations. Client identities withheld for confidentiality; all dashboards on this site use illustrative demo data only.