🗄️ Data Platform · 4 dashboards
Data Platform AI Dashboards
Pipeline health, data quality, model monitoring, spend. Each is a deliberately different layout — click into any one to drill down. Modeled on real dashboards Peter Saddington builds for clients; all demo data.
The 4 examples
click any card to open the live demo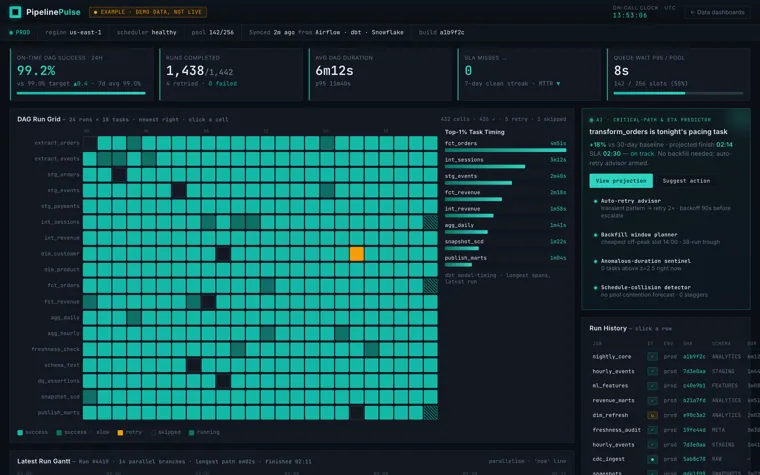
Data Eng · On-callopen →
Pipeline Pulse
Dark ops-console: a rigid DAG run-grid matrix paired with a Gantt parallelism strip — scan for the single off-color ce…
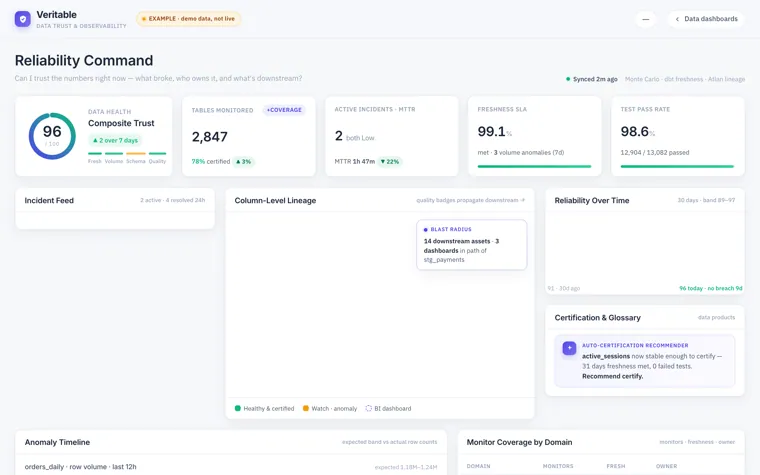
Analytics Eng · Reliabilityopen →
Trust
Light editorial: a left incident feed beside a center column-level lineage graph where quality badges propagate downst…
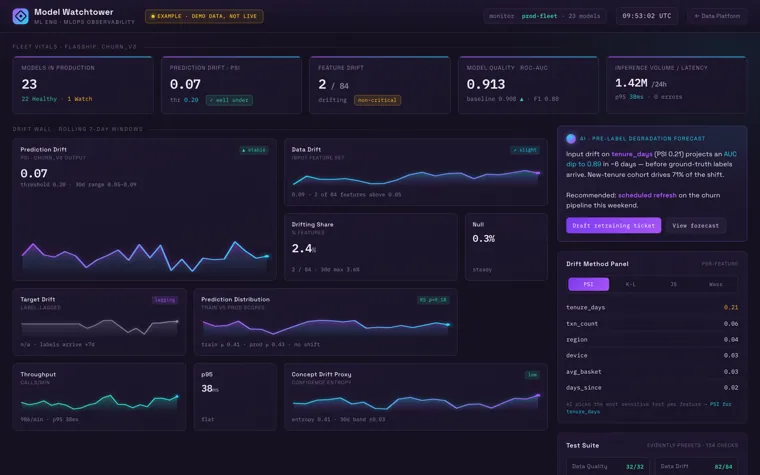
ML Eng · MLOpsopen →
Model Watchtower
Dark-violet lab: a bento wall of glowing time-series tiles — drift, performance, and distribution sparklines tiled lik…
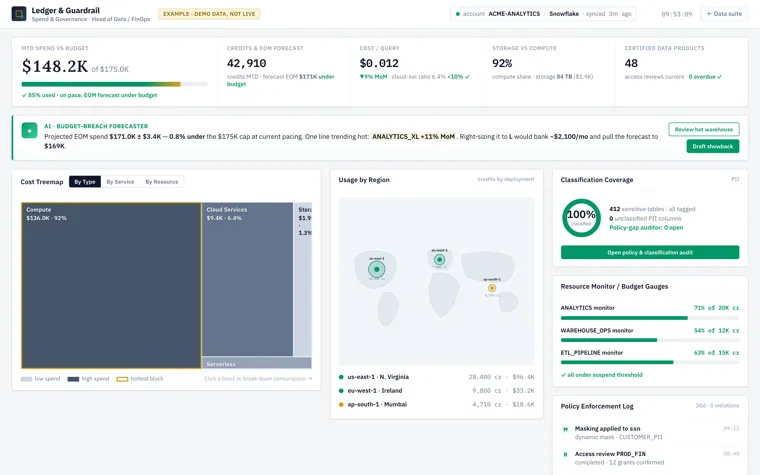
Head of Data · FinOpsopen →
Spend & Governance
Light finance: dense ruled tables + a cost treemap + a usage-by-region map, slate with one gold accent.
Watch the Council review them— four AI agents walk every dashboard